Development and Validation of a Computer Crash Simulation Model of an Occupied Adult Manual Wheelchair Subjected to a Frontal Impact
R. Dsouza, BS*, G. Bertocci, PhD*
*Injury Risk Assessment and Prevention (iRAP) Laboratory, Mechanical Engineering Department, University of Louisville
ABSTRACT
Computer simulations can provide a supplemental approach to sled impact testing to assess wheelchair response and loading under crash conditions. In this study a computer model was developed and validated to simulate a wheelchair and occupant subjected to a WC-19 frontal impact test. Two frontal impact (20g/30mph) WC19 compliant sled tests were conducted using identical, commercially available, manual wheelchairs with a seated 50th percentile Hybrid III ATD. A model was developed and validated against sled test data using visual comparisons of wheelchair and occupant kinematics, and statistical assessments of outcome measures. All statistical evaluations were found to be within the acceptance criteria, indicating the model’s high predictability of the sled tests. This model provides a useful tool for the development of crashworthy wheelchair design guidelines, as well as the development of transit-safe wheelchair technologies.
KEYWORDS
Wheelchair Transportation Safety, Computer Simulation Model
BACKGROUND
The Americans with Disabilities Act (ADA) (1) has been instrumental to wheelchair users seeking transportation in motor vehicles. There is an estimated 2.7 million wheelchair users (2002) in the U.S (2), of which many travel seated in wheelchairs not designed for this purpose. During a motor vehicle crash, these wheelchair-seated individuals are at a higher risk of injury than occupants seated in original equipment manufactured motor vehicle seats.
In response to this problem, a voluntary industry standard was adopted that focused on improving the crashworthiness of wheelchairs used as motor vehicle seats (ANSI/RESNA WC-19) (3). This standard (3) specifies general design and performance requirements along with test procedures for wheelchairs used as seats in motor vehicles. In addition, WC-19 requires a 20g/30mph frontal impact sled test to evaluate the dynamic strength and assess the performance of occupied, forward-facing wheelchairs under crash conditions. This sled testing provides insights into the wheelchair and occupant loading and dynamics during a frontal impact which could facilitate design improvements and development of crashworthy wheelchairs. However, dynamic testing requires the use of costly sled testing facilities, complex instrumentation and data logging systems in addition to costs associated with wheelchair and Anthropomorphic Test Device (ATD) procurement.
Computer simulations, a parallel or supplemental approach to dynamic testing, can offer an economical and versatile method for analyzing wheelchair crash response. In this study, a frontal impact crash dynamic model representing a manual wheelchair and occupant was developed and validated.
Previous wheelchair transportation safety studies have utilized validated computer models to improve the design of wheelchairs intended for use as a motor vehicle seat by establishing design criteria and conducting parametric sensitivity analysis to determine the influence of various factors on wheelchair loading and occupant injury risk (17-21)(23-26). Similarly the model developed in this study could provide researchers an additional versatile, cost effective tool to further the development and design of safe and crashworthy wheelchairs.
OBJECTIVE
Develop a validated frontal impact, manual wheelchair crash simulation model to reflect WC-19 (3) dynamic sled testing, which could be utilized by researchers in developing enhanced, crashworthy wheelchairs and components.
METHODS
Methods – Sled Testing
The performance of two identical, manual, adult wheelchairs (Compass Allegro–mass 46lbs-Invacare fixed seating system) were evaluated in accordance with the frontal impact testing procedures set forth in Vol. 1, Annex A of section 19 ANSI/RESNA (3). In each test, the wheelchair was secured to the sled platform using a surrogate 4-point, strap type tiedown (31), while the wheelchair occupant, represented by a 50th percentile adult, male Hybrid-III (168lbs) ATD was restrained by a surrogate, vehicle-anchored, 3-point occupant restraint system. Instrumentation consisted of load cells fitted on the WTORS (Wheelchair Tiedowns and Occupant Restraint System) along with accelerometers located at the wheelchair center of gravity (CG), ATD head CG, chest and pelvis, which were all filtered as per SAE J211 (30). Also, three high speed (1000-fps) digital video cameras were used to record the test.
This sled testing provided impact response characteristics and kinematic data for the wheelchair and ATD, as well as WTORS loading; all utilized in computer model validation.
Methods – Model Development
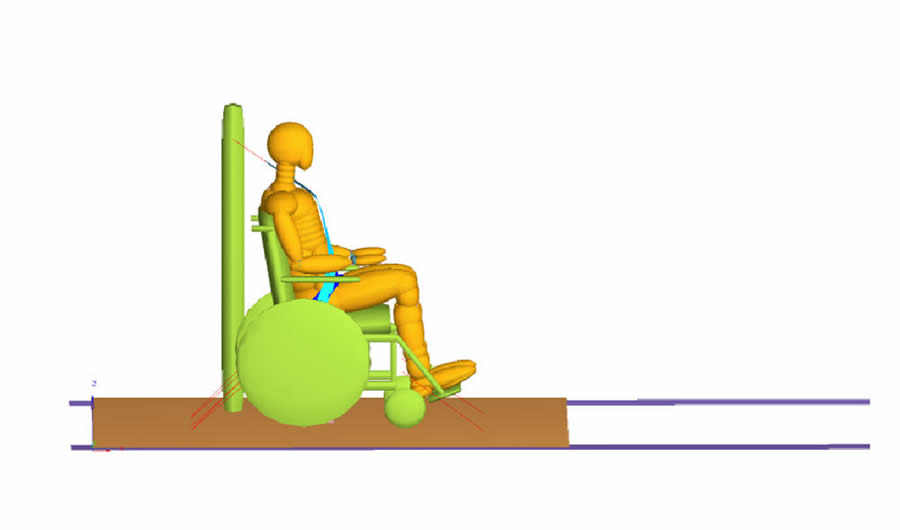 Figure 1. MADYMO model of secured wheelchair and restrained occupant on sled platform. (Click for larger view)
 A model consisting of the sled platform, wheelchair and ATD, was developed in MADYMOTM (29) to represent the utilized sled test configuration. MADYMO was selected over other simulation software as it is capable of analyzing a combination of multi-body and finite element (FE) models allowing for an enhanced, realistic representation of the occupant restraints and wheelchair components. Also, MADYMO has successfully been used previously to develop models of manual, powered, surrogate (28) and pediatric wheelchairs (21). The wheelchair and sled platform were represented in MADYMO by a combination of ellipsoids and planes with relevant dimensions, mass and inertia properties. The entire wheelchair was represented by 32 ellipsoids joined together using a combination of fixed, revolute or pin joints. Belt segments were used to model the four point strap type tiedowns used to secure the wheelchair to the sled platform.
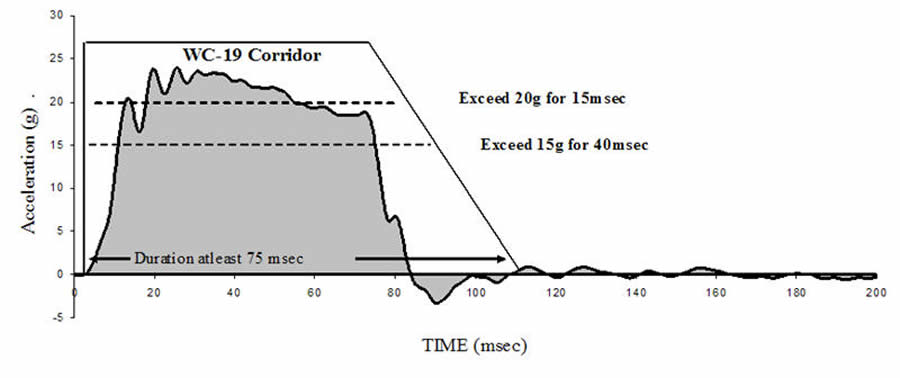 Figure 2: Sled deceleration pulse (shaded curve) placed within the WC-19 corridor (Click for larger view)
 The Hybrid III 50th percentile male ATD available within MADYMO represented the wheelchair-seated occupant. The ATD model was restrained by a three point vehicle anchored belt system modeled using FE belts: these provide an enhanced belt fit and realistic simulation, by allowing friction between belts and contacting surfaces.
This developed model (Figure 1) was subjected to the 20g/30mph frontal impact crash pulse using data recorded from sled testing (Figure 2).
Methods – Model Validation
As established by previous studies related to the validation of computer simulation models; visual comparisons of the model-predicted gross kinematics of wheelchair and ATD verses those recorded from the high speed sled test videos were performed (4-17)(20-22). Following this, the model’s predicted time histories of force and acceleration data were superimposed over respective sled test time-history min-max corridors. Adjustments and tuning of model parameters including, but not limited to, changes in the stress-strain and stiffness characteristics of the occupant belt, tiedowns, seat, seatback and tires were performed until time-history plots shared similar trends across sled tests and model.
The rigor of statistical verification has not typically been conducted to prove computer model validation, with the exception of a few studies (17)(20-22). However, statistical analysis can quantify the association between outcome measures of the sled test and computer model, and hence was utilized in this study. Statistical assessments were employed in comparing sled test data (mean value of the two tests) to model outcome measures (Table 1) for nine time-history signals, including the accelerations of the wheelchair CG, ATD head, chest and pelvis, and force time history signals of the occupant lap belt, shoulder belt and wheelchair rear tiedowns (front tiedowns were not evaluated since front tiedown loading is negligible in frontal impacts).
Statistical Test |
Definition |
Range of Values |
|---|---|---|
| Mean Value Ratio | Defines a ratio between the averages of the values in the time history signal of the sled test to those of the model. | -∞ to ∞ A result near unity would indicate that the two time histories are likely to be the same or related |
| Pearson’s Correlation Coefficient (r) | ‘r’ is a common measure of the correlation between two variables, and reflects the strength and direction of a linear relationship between the two variables. | -1 ≤ r ≤ 1 The value of ‘r’ ranges from +1 (perfect positive linear relationship) to -1 (perfect negative linear relationship), with a value of 0 indicating no linear relationship between the two variables. |
| Coefficient of Determination (r2) | ‘r2’ describes the proportion of the variance (fluctuation) that can be accounted for by a given variable, which is predicted from the other variable. In simpler terms, it provides information about the goodness of fit of a model as compared to the test. | 0 ≤ r2 ≤ 1 The value of r2 can range in value from 0 to 1, with 1 indicating a perfect fit between test and model. |
| Mean Absolute Percentage Error (MAPE): | MAPE is a measure of accuracy in a modeled time series value in statistics. It describes the accuracy of one curve to another as a percentage. The MAPE was calculated for the time duration of 20-80msec of all the time histories except head acceleration, which was calculated for 20-120msec. This captured the primary impact phase while eliminating inaccuracy in the calculation caused by noise in the signals prior to and after the set time periods. | 0% to X % 0% indicating no error between model and test while X % indicating X amount of error between model and test. |
| Standard Deviation (σ) of the Absolute of the Percentage Error (APE) | σ assesses the deviation of the error from the mean value over the entire series (spread of the error values about the mean error value). Calculated on the already established MAPE | Dependent upon MAPE |
RESULTS
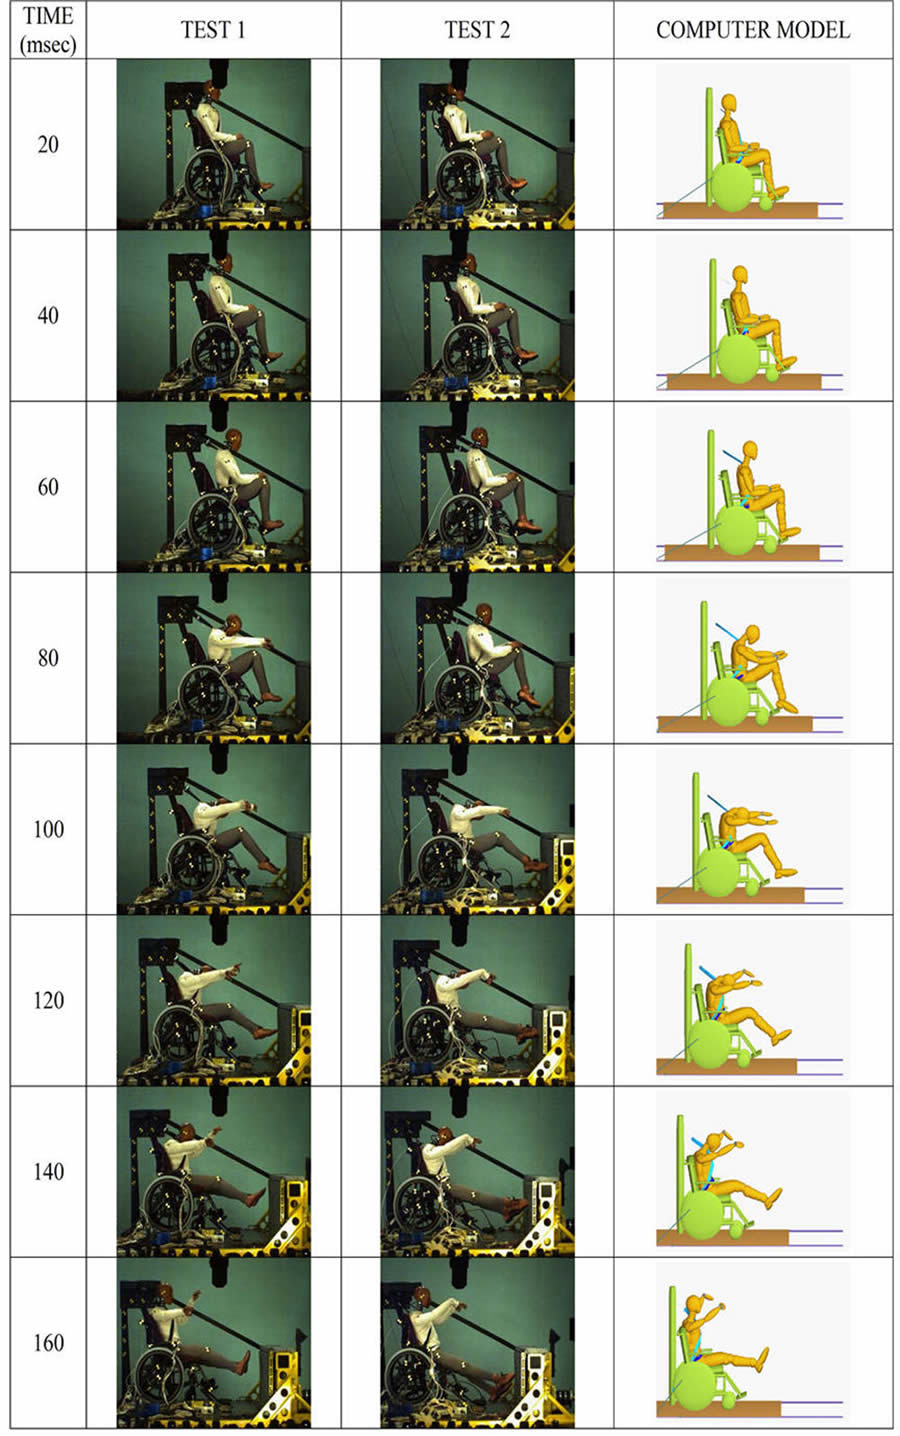 FIGURE 3: Comparison of Kinematics (Click for larger view)
 A side-by-side comparison of time sequenced images (20 msec apart) from the high-speed videos of the sled tests and the animations of the computer simulation model illustrating wheelchair and ATD kinematics are shown in Figure 3.
The visual comparison in Figure 3 shows reasonable agreement in the model- predicted gross kinematics of the wheelchair and ATD to those observed from the high-speed sled test videos.
Figures 4–12 present the time histories for the 9 different loading and acceleration output parameters as generated by the computer model (red), superimposed over the sled test min-max corridors shown in gray.
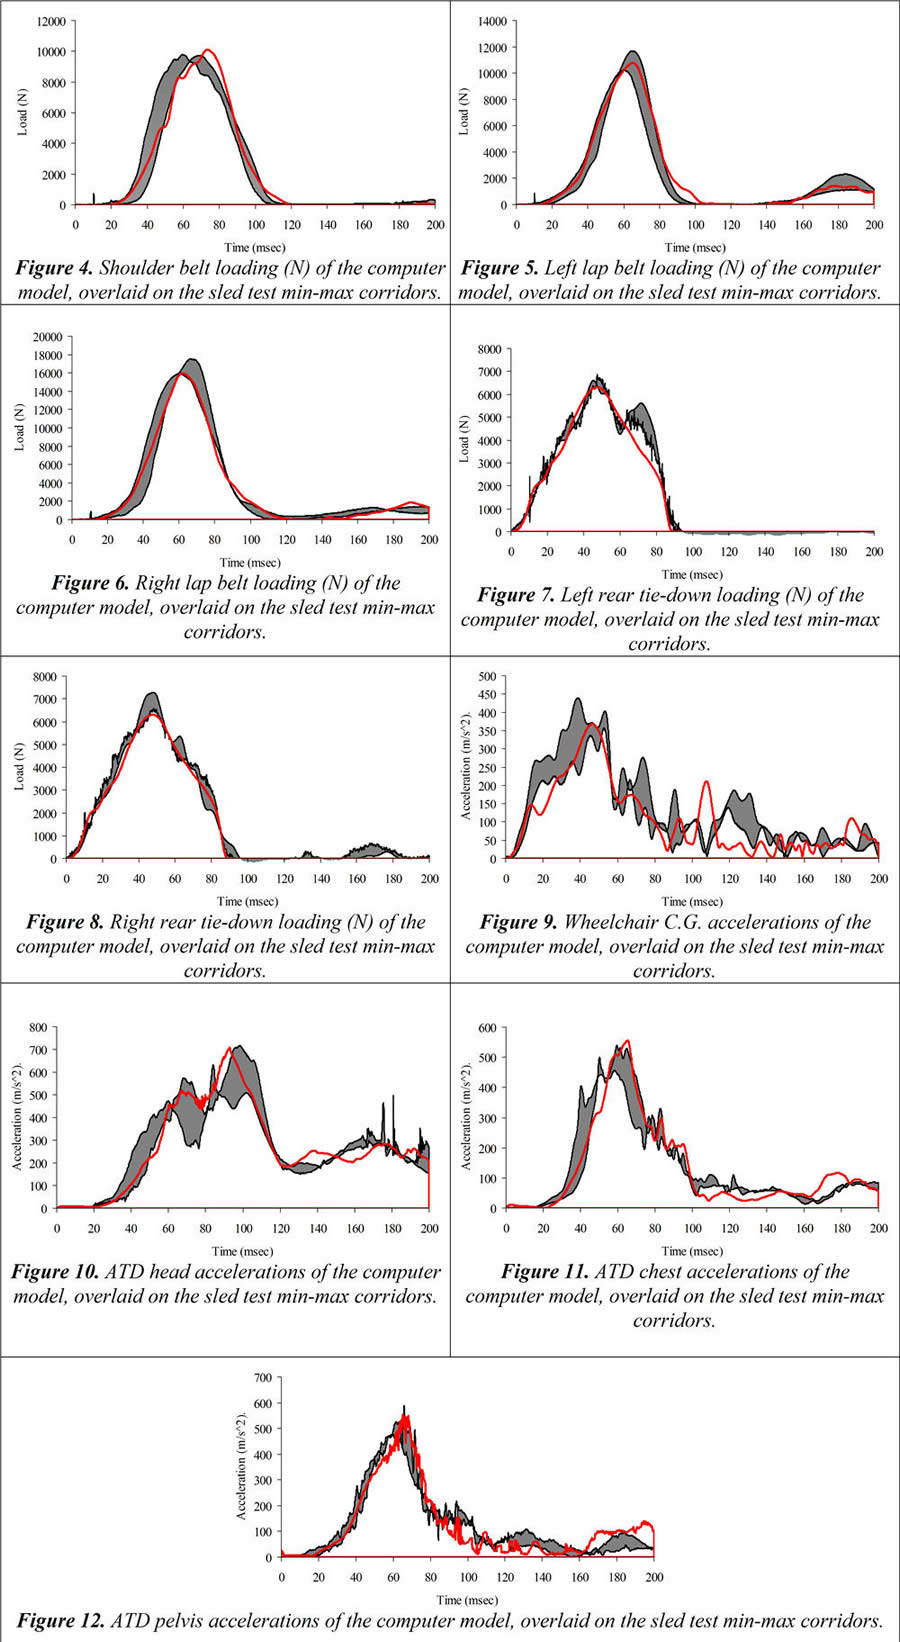 Figures 4 - 12 (Click for larger view)
 Figures 4-12 establish that a majority of the curve profiles fell within the shaded area representing the sled test min-max time history corridors. These time history profiles appeared very comparable between the sled testing and computer model, having similar trends in peak values, rise and fall rates and time of peak occurrences.
Table 2 summarizes the statistical assessments for the various outcome measures to evaluate validity between the model and sled test time histories.
From Table 2, it is established that the arithmetic mean of the Mean Ratio, ‘r’, ‘r2’ and MAPE for all outcome measures are well within the acceptance criteria. An overall mean standard deviation percentage error of 12% was calculated in the comparison of computer model and sled tests.
DISCUSSION
Validation of the computer model firstly involved visually comparing simulated wheelchair and ATD kinematics to the sled tests (Figure 3). The model-predicted wheelchair and occupant impact response was found to be representative of the sled test response. Next, model outcome measures were visually compared to corresponding sled test time-histories (Figures 4-12). This comparison suggested a strong agreement between the model and sled tests outcome measures.
Outcome Measures |
Mean Ratio |
Pearson’s Correlation Coefficient |
Coefficient of Determination |
MAPE |
Standard Deviation of % Error |
|---|---|---|---|---|---|
Shoulder Belt |
0.99 |
0.98 |
0.96 |
20 % |
16 % |
Left Lap Belt |
1.08 |
0.99 |
0.98 |
12 % |
10 % |
Right Lap Belt |
0.96 |
0.99 |
0.98 |
13 % |
10 % |
Left Rear Tie Down |
0.98 |
0.98 |
0.96 |
11 % |
10 % |
Right Rear Tie Down |
0.94 |
0.99 |
0.98 |
6 % |
6 % |
Wheelchair C.G. Acc (Resultant) |
0.83 |
0.86 |
0.74 |
15 % |
11 % |
ATD Head Acc (Resultant) |
1.00 |
0.96 |
0.92 |
19 % |
13 % |
ATD Chest Acc (Resultant) |
0.99 |
0.96 |
0.92 |
23 % |
20 % |
ATD Pelvic Acc (Resultant) |
1.00 |
0.94 |
0.88 |
13 % |
10 % |
Mean |
0.97 |
0.96 |
0.93 |
15 % |
12 % |
Acceptance Criteria |
0.8 – 1.2 |
≥ 0.8 |
≥ 0.8 |
20 % |
- |
| Note: MAPE = Mean Absolute Percentage Error | |||||
In addition to visual comparisons, statistical analysis (Table 2) was employed to further assess and quantify the computer model validity.
All outcome measures exhibited a mean ratio (0.83–1.08) well within the acceptable limit of 0.8-1.2 (22), with the total average mean ratio of 0.97, indicating a near identical relation between the sled tests and model. ‘r’ ranged from 0.86 to 0.99, with an average of 0.96 (validation criteria in other studies (21)(22) defined an acceptable range of r > 0.8) for all outcome measures, signifying a highly linear relationship between sled tests and model outcome measures. This linear relationship implies that changes made to a sled test would yield similar results in the outcome measures if the same changes were applied to the model.
‘r2 ’ ranged from 0.98–0.74, with an average of 0.93 across all outcome measures and within the acceptable range of 0.8 (21-22). This implies that 93% of the model’s outcome measure profiles can be explained by the linear relationship between the outcome measures of the sled test to those of the model. The model’s predicted primary impact phase was found to have a mean error of 15% (± SD=12%) when compared to the test data. A value of 20% was deemed acceptable.
Based upon the presented results and statistical comparisons, it is concluded that the developed computer model provides an adequate representation of the frontal impact sled test performed to evaluate wheelchair crashworthiness (3).
OUTCOME/IMPLICATIONS
The frontal impact model developed and validated in this study provides the means for studying associated wheelchair and WTORS loading, as well as potential occupant injury risks. Through parametric sensitivity studies, this model can provide information regarding the effects of design parameters on the crashworthiness of the wheelchair. This model is also a powerful tool for developing design criteria by studying the influence of various parameters, such as seated posture, wheelchair tiedown configuration, crash pulse, securement point location and restraint configuration (vehicle vs. wheelchair mounted restraints) on injury risk and occupant crash response as performed by other studies (17-21)(23-26).
One of the primary reasons for developing this model was to aid in the design and development of energy absorbing wheelchair casters with the intent to reduce injury risk to wheelchair-seated occupants exposed to frontal impacts. This computer model will allow design optimizations to maximize crash energy absorption while maintaining suitable occupant kinematics. This well-validated model having the capability of predicting response dynamics of the wheelchair and occupant will prove to be an invaluable design tool to the success of this project.
LIMITATIONS
One of the limitations of this study is that this model (as well as all mathematical models) is a discrete representation of real world environments. Accordingly, simulation models may fail to capture all aspects of the situation they are representing. Also, “assumptions are inherent in any mathematical model” and “a given model may yield better predictions for one situation than for another” (27). Although all efforts were made to reflect dimensional and inertial properties of the wheelchair and its components, assumptions for certain component stiffness values were made and tuned as required to obtain a validated model.
In the present model, verification testing that consists of altering one parameter in the sled test to study its representative effect in the validated model was not performed. This verification would further enhance the validity of this model.
REFRENCES
- “Americans with Disabilities Act (ADA) (1991) Accessibility Guidelines for Transportation Vehicles”, Architectural and transportation Barriers Compliance Board (ATBCB), 36 CFR Part 1192, Federal Register, Vol. 56, No. 173. September 1991
- Americans with Disabilities: 2002, Household Economic Studies, Current Population Reports P70-107, U.S. Census Bureau.
- ANSI/RESNA Subcommittee on Wheelchairs and Transportation (2000). ANSI/RESNA WC/Vol.1, Section 19: Wheelchair Used as Seat in Motor Vehicles.
- Ridella S. (2000), Computer Simulation for the Design of Automotive, Occupant Restraint Systems, TRW Occupant Safety Systems, Technology Review Journal- Pages 47-52, Fall/Winter 2000, Millennium Issue
- Konosu, A., Ishikawa, H. and Sasaki A. (1998), A Study on Pedestrian Impact Test Procedure by Computer Simulation - The Upper Legform to Bonnet Leading Edge Test, Presented at the 16th Enhanced Safety of Vehicles (ESV) Conference, Canada, May 31- June 4
- Zaouk A., Bedewi N., Kan C., and Marzougui D. (1996), Validation of a non-linear finite element vehicle model using multiple impact data, International Mechanical Engineering Congress and Exposition, November 17-22
- Deshpande B., Gunasekar T., Gupta V. and Jayaraman S. (1999), Development of MADYMO Models of Passenger Vehicles for Simulating Side Impact Crashes, SAE-Future Transportation Technology Conference and Exposition, Costa Mesa, California, August 17-19
- Kirkpatrick S., Simons J., and Antoun T. (1998), Development and Validation of High Fidelity Vehicle Crash Simulation Models, International Crashworthiness Conference, IJCRASH’98, September 9-11
- Galganski R., Hatziprokopiou L., Hulme K., Patra A., Vusirikala N. (2004), Integrated Sled Testing, Computer Modeling, and Scientific Visualization for Crashworthy Child Restraint System Design, Intelligent Transportation Systems Safety And Security Conference, March 24-25
- Commuter Rail Seat Testing and Analysis of Facing Seats (2003), U.S. Department of Transportation, Federal Railroad Administration, Final Report, December 2003, DOT/FRA/ORD-03/06
- Jenkins J., Ridella S. and Ham S. (2002), Development of an Inflatable Knee Bolster by using MADYMO and DOE, 9th International MADYMO User’s Conference
- Deter T., Malczyk A., Kuehn M. (2007), Validation of a Seat-Dummy Simulation Model for Rear-Impact, Presented at the 20th Enhanced Safety of Vehicles (ESV) Conference, France, June 18-21
- Edvards, M. & Neale, M. (2000). The effectiveness of lap straps as seat restraints on tractors in the event of overturning, TRL Limited for the Health and Safety Executive, Contract research report 310
- Kirkpatrick S., MacNeill R., and Bocchieri R. (2003), Development of an LS-DYNA Occupant Model for use in Crash Analyses of Roadside Safety Features, TRB 2003 Annual Meeting, Paper No. 03-4450
- Marzougui D., Kan C., and Bedewi N. (1995), Development and validation of an ncap simulation using ls-dyna3d, Fourth International LS-DYNA3D Conference, Spain, 1995, pp.319-332
- Kirkpatrick S., Holmes B., Hollowell W., Gabler H., Trella T. (1993), Finite Element Modeling of the Side Impact Dummy (SID), SAE Publications, SP-945, Presented at the 1993 International Congress and Exposition, March 1993, SAE Paper No. 930104
- Bertocci G.E., Digges, K., Hobson D.A. (1999), Computer Simulation and Sled Test Validation of a Powerbase Wheelchair and Occupant Subjected to Frontal Crash Conditions, IEEE transactions on rehabilitation engineering, vol. 7, no. 2, June 1999, pages 234-244
- Bertocci G.E., Szobota S., Ha D., van Roosmalen L.(2000), Development of Frontal Impact Crashworthy Wheelchair Seating Design Criteria Using Computer Simulation. Journal of Rehabilitation Research and Development 37(5): 565–72
- Ha D., Bertocci G. (2003), An Investigation Of Manual Wheelchair Seat Pan and Seat Back Loading Associated with Various Wheelchair Design Parameters Using Computer Crash Simulation. Proceedings Annual RESNA Conference, Atlanta, GA, June 2003
- Leary A. (2001), Injury Risk Analysis and Design Criteria for Manual Wheelchairs in Frontal Impacts, unpublished Masters thesis, School of Engineering, University of Pittsburgh, 2001
- Ha D. (2004), Pediatric Wheelchair Transportation Safety: Transit Manual Wheelchair Design Guidelines and Injury risk of 6-year old Children in a Frontal Motor Vehicle Impact. Dissertation in Rehabilitation Science and Technology. 2004. Pittsburgh: University of Pittsburgh
- Pipkorn B., Eriksson M. (2003), A method to Evaluate the Validity of Mathematical Models. Paper presented at the 4th European MADYMO Users Meeting, Brussels, Belgium, 2003
- Bertocci G.E., Digges K., Hobson D. (1996), Development of Transportable Wheelchair Design Criteria Using Computer Crash Simulation, IEEE Transactions of Rehabilitation Engineering, September 1996, 4(3): 171–81
- Bertocci G.E., Digges K., Hobson D. (2000), Development of a Wheelchair Occupant Injury Risk Assessment Method and its Application in the Investigation of Wheelchair Securement Point Influence on Frontal Crash Safety. IEEE Transactions on Rehabilitation Engineering, March 2000, 8(1): 126–39
- Kang W., Pilkey W. (1998), Crash Simulations of Wheelchair Occupant Systems in Transport, Journal of Rehabilitation Research and Development, January 1998, 35(1): 73–84
- Bertocci G.E. and Evans J. (2000), Injury Risk Assessment of Wheelchair Occupant Restraint Systems in a Frontal Crash: A Case for Integrated Restraints, Journal of Rehabilitation Research and Development, September-October 2000, 37(5): 573–90
- Fleck J.T., Butler F.E., Deleys N.J. (1982), Validation of the Crash Victim Simulator, Volume 2, Engineering Manual-Part II: Validation Effort, August 1982, PB86 212446/AS, DOT HS 6 01300
- The safety of wheelchair occupants in road passenger vehicles, Department for Transport - United Kingdom
- MADYMOTM - MAthematical DYnamic Model, TNO Automotive Safety Solutions, Livonia, MI-48152, USA
- Society of Automotive Engineers (SAE) – J211- Instrumentation for Impact Testing
- Society of Automotive Engineers (SAE) Recommended Practice J2249 -Wheelchair Tiedowns and Occupant Restraints for Use in Motor Vehicles
ACKNOWLEDGEMENTS
This study was supported through NIH STTR#1R41HD047105-01 and the University of Louisville. The opinions expressed herein are those of the authors and do not necessarily represent those of the funding agencies.
CONTACT INFO:
Raymond Dsouza, BS, Injury Risk Assessment and Prevention (iRAP) Laboratory, Mechanical Engineering Department, University of Louisville, Instructional Building B – Room 110, 500 S. Preston St., Louisville, KY 40202, Tel: (502) 852-0279, Email: raymond.dsouza@louisville.edu